Monitoring Proxmox environment is an essential administrative practice for maintaining a healthy and fully functional system.
It allows administrators to proactively identify and fix issues before they lead to service disruptions.
This guide uses an Ubuntu Linux machine to set up the monitoring stack.
Install InfluxDB
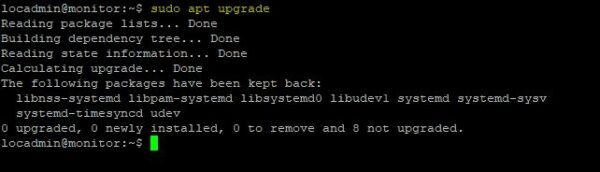
The first step is to ensure the Ubuntu system is up to date.
Add the InfluxDB repository
An APT repository is available for InfluxDB that simplify the installation procedure. Add the repository with the following command:
# sudo tee /etc/apt/sources.list.d/influxdb.list<<EOF
> deb [signed-by=/usr/share/keyrings/influxdb-keyring.gpg] https://repos.influxdata.com/ubuntu jammy stable
> EOF

Import the InfluxDB GPG key.
# curl -fsSL https://repos.influxdata.com/influxdata-archive_compat.key|sudo gpg --dearmor -o /usr/share/keyrings/influxdb-keyring.gpg

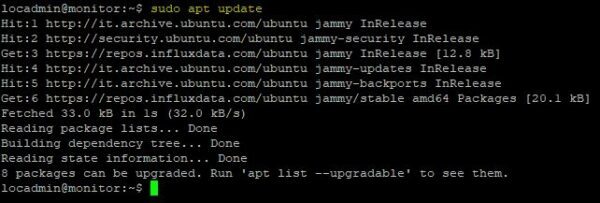
Update the list of available packages.
# sudo apt update
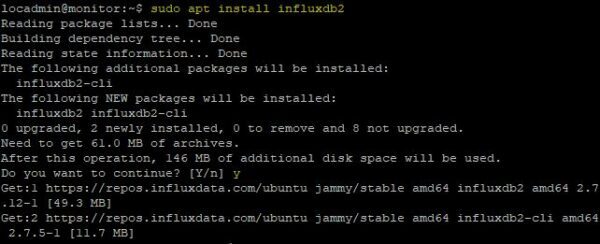
Run the following command to install InfluxDB.
# sudo apt install influxdb2
Start the InfluxDB service.
# sudo systemctl start influxdb

Enable the service to start automatically on boot.
# sudo systemctl enable influxdb

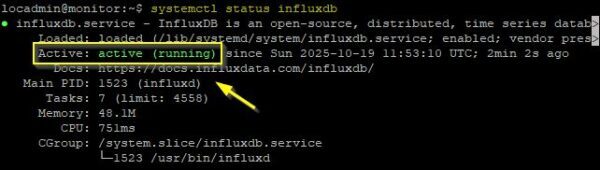
Check the service status to ensure the service is running correctly.
# systemctl status influxdb
This article has been written for StarWind blog and can be found in this page. It covers the full procedure to monitor Proxmox with InfluxDB and Grafana.
Monitoring Proxmox with InfluxDB and Grafana
Once the Dashboard is imported in Grafana, metrics begins to be displayed.

By monitoring Proxmox with this setup, administrators can ensure the correct functionality of their cluster and avoid dangerous issues that might otherwise go undetected.
Read the full article on StarWind blog.