Opvizor released a real-time Performance Analyzer 3.0 for vSphere, a product to get analysis of your virtual infrastructure and instantly identify infrastructure performance and scalability problems in real-time.
The new product comes as a standalone product and it is delivered as a VMware OVF Template. In addition to Performance Analyzer, Opvizor offers VMware Health Analyzer and Snapwatcher to analyze and maintain your virtual infrastructure performance.
Install Performance Analyzer
From Opvizor website download Performance Analyzer 3.0 for vSphere and extract the ZIP archive.
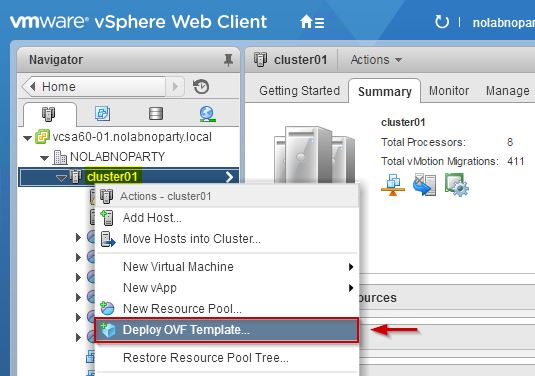
From VMware Web Client, right click the cluster or datacenter name and select Deploy OVF Template option.
Click Browse button and select the .ovf file extracted from the archive just downloaded. Click Next.
Click Next to continue.
Give the appliance a Name and select a folder or datacenter then click Next.
Select the virtual disk format and the storage then click Next.
The IP allocation is automatically set as Static - Manual. Click Next to continue.
Optionally enable Power on after deployment option and click Finish to start installation.
Configure the VA
Once the deployment has been completed, log into the console using the following credentials:
username: admin
password: VMware123
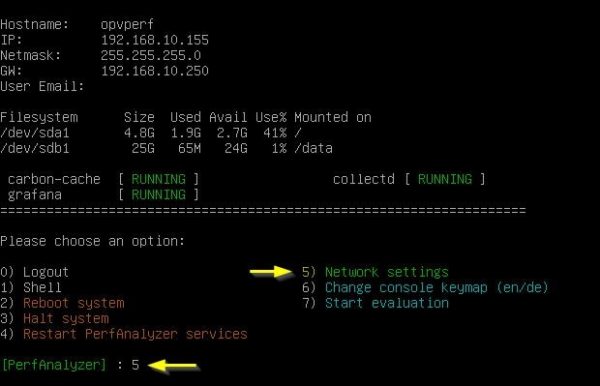
Change the IP configuration typing 5 then press Enter.
Enter the network parameters and the hostname.
Enter Y to update network settings.
When the network settings has been applied, press Enter to reboot the system.
Using your favorite browser, type the address http://<IP_Address_DNS_name>/admin to access the Opvizor web admin console. Enter same credentials as above and click Login.
In the Overview screen you have the options to Add a purchased license (leaving this field blank, you have a 30-day trial license to test the product) and to perform the upgrade of the appliance. Using the Browse button select the upgrade file downloaded from Opvizor website then click Upload.
Select Infrastructure > VMware tab and click Add new on the right pane to specify the vCenter Server.
Enter the Host and the credentials of your vCenter Server then click Add.
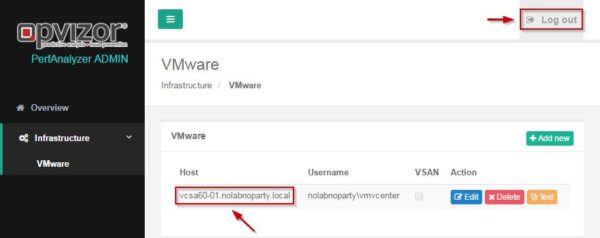
The specified vCenter Server is displayed in the Host's list. Click Log out to exit the admin console.
Using your favorite browser, type now the address http://<IP_Address_DNS_name> to access the Opvizor web console. Enter same credentials as above and click Log in.
From the Dashboard select Admin > Global Orgs to configure your organization and users.
Click Edit to modify the organization's name.
Type the Name of your organization then click Update.
The new organization's name is now set.
Now select Admin > Global Users to configure the users.
Click Edit to modify an existing user or click Add new user to configure a new account.
Edit user's details and change the Password for security reasons then click Update to save settings.
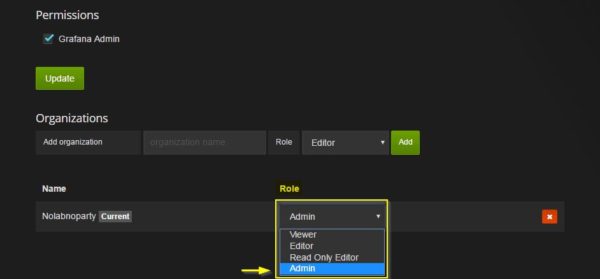
You can also grant to the user the correct Permissions from the drop-down Role menu.
Click Exit admin to go back to the Dashboard.
Leave the system running for some hours in order to collect information about your environment.
Check data collection
From main Dashboard you can analyze your environment selecting the available statistics through the Dashboard drop-down menu.
Admin: Graphite Server
Select from the drop-down menu the Admin: Graphite Server dashboard to check the data collection related to the appliance.
VMware Statistics: Overall Infrastructure
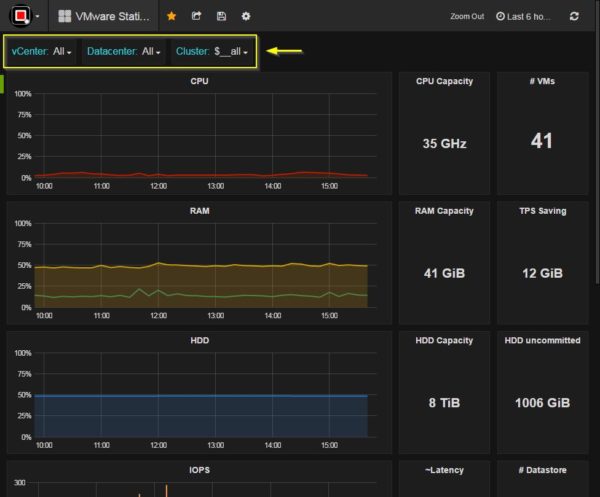
From the drop-down menu select VMware Statistics: Overall Infrastructure to see your complete environment including vCenter, Datacenter and Cluster.
To select a different time range to see the data history, click on the clock symbol in the top right corner.
Select the time range you need.
VMware Performance: VM Cluster
To check for the Virtual Machines statistics, select the VMware Performance: VM Cluster dashboard. You have a global overview of your environment with the ability to narrow the selection down to a cluster.
Additional details are available scrolling down the dashboard that help to troubleshoot performance bottlenecks.
VMware Capacity Planning: Cluster
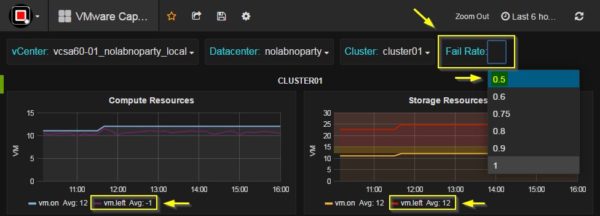
Selecting the VMware Capacity Planning: Cluster dashboard you can do some capacity planning on your environment getting information about the current load and the VMs that can still be deployed.
If you click with the mouse in any point within the chart, you can check also the details.
Selecting a different scale, you can adjust the resources available in the cluster. For example, setting the scale as 0.5 only the 50% of the current resources are available to the VMs and the number of VMs that can still be deployed reduces significantly.
VMware Performance: Storage Cluster
Selecting the VMware Performance: Storage Cluster dashboard you can get some statistics related to the storage.
Dashboard Settings
Clicking on the Settings icon you can manage the dashboard, make annotations, export, etc.
Settings available to manage the dashboard.
Download the 30-day trial of Performance Analyzer for vSphere to try out the product.


