Latest Nakivo Backup & Replication 10.5 version introduces the new real-time IT Monitoring capability providing an overview of your virtual infrastructure health.
This new feature monitors resource usage (CPU, RAM and disk) for your hosts, VMs and datastores from a single pane of glass allowing the administrators to maintain an optimal status of your infrastructure.
Currently the IT Monitoring capability is available for VMware vSphere platform only.
Through the Monitoring area, you can see and analyze vSphere resources demanding:
- vCPU Load/usage
- RAM Load/usage
- Disk Usage (vSphere and Datastores)
Key features
With IT Monitoring you can simplify the management of resource allocation, physical resources, networking and data protection leveraging the following capabilities:
- All-in-One IT Monitoring - the entire infrastructure can be monitored from a single dashboard displaying CPU, RAM and disk usage by virtual machines, host and datastores.
- Resource management - in addition to the real-time resource usage, the dashboard provides also historical data logs useful to know resource requirements of VMs, hosts and datastores.
- Load distribution - analyzing the data you can detect hardware performance issues and resource bottleneck and fixing them by distributing the load between VMs and hosts.
- Scalability forecasting - by monitoring the resource usage, you can predict when additional hardware must be deployed to your infrastructure.
Configure IT Monitoring
From the Nakivo dashboard, access the IT Monitoring area.
Click Add Monitored Items to add objects to analyze.
To select objects to process, you can select by Items or by Policy.
Select objects by Items
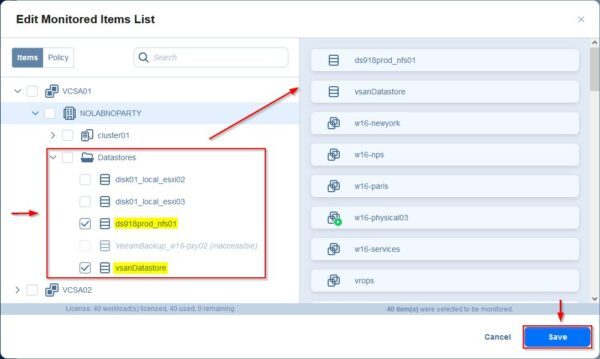
Click the Items button and select the objects you want to analyze.
Virtual machines, hosts and datastores can be selected for monitoring. Click Save to save the selection.
Select objects by Policy
Click the Policy button and specify the criteria to select objects to analyze then click Save.
Once the selection has been saved, the system starts gathering the information.
Check results
Leave the system running for at least one hour before analyzing collected data.
VMs metrics
Select the VM to analyze and check the resource usage.
CPU Load, Memory Load, and Disk usage are the metrics available for analysis.
Datastores metrics
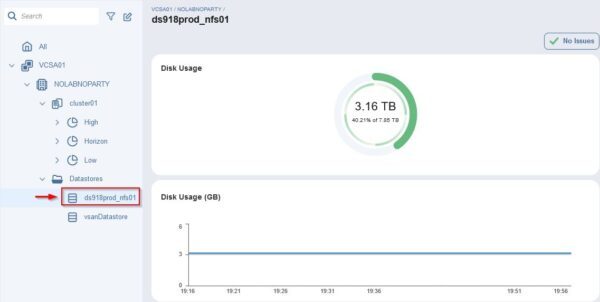
Connected datastores can be monitored to keep disk usage under control.
vSAN is also supported by the IT Monitoring tool.
Hosts metrics
Monitoring ESXi hosts in your infrastructure is very important to avoid resources contention and to know in advance if new hardware needs to be deployed to satisfy resource demand.
IT Monitoring is a useful tool to keep the infrastructure under control in terms of performance and resource usage.
The IT Monitoring tool is included in Nakivo Backup & Replication v10.5 available to download as 30-day trial.


